










Measurement under real-world conditionsWeb, Mobile, and APIsThreshold Exceeded Alert

Performance Tests: See How Your Pages Slow Down Before Your Customers Do

A page that takes six seconds to load doesn't trigger any technical alerts. It just drives the user away. Mr Suricate the actual time of your user journeys, step by step, as often as you choose.

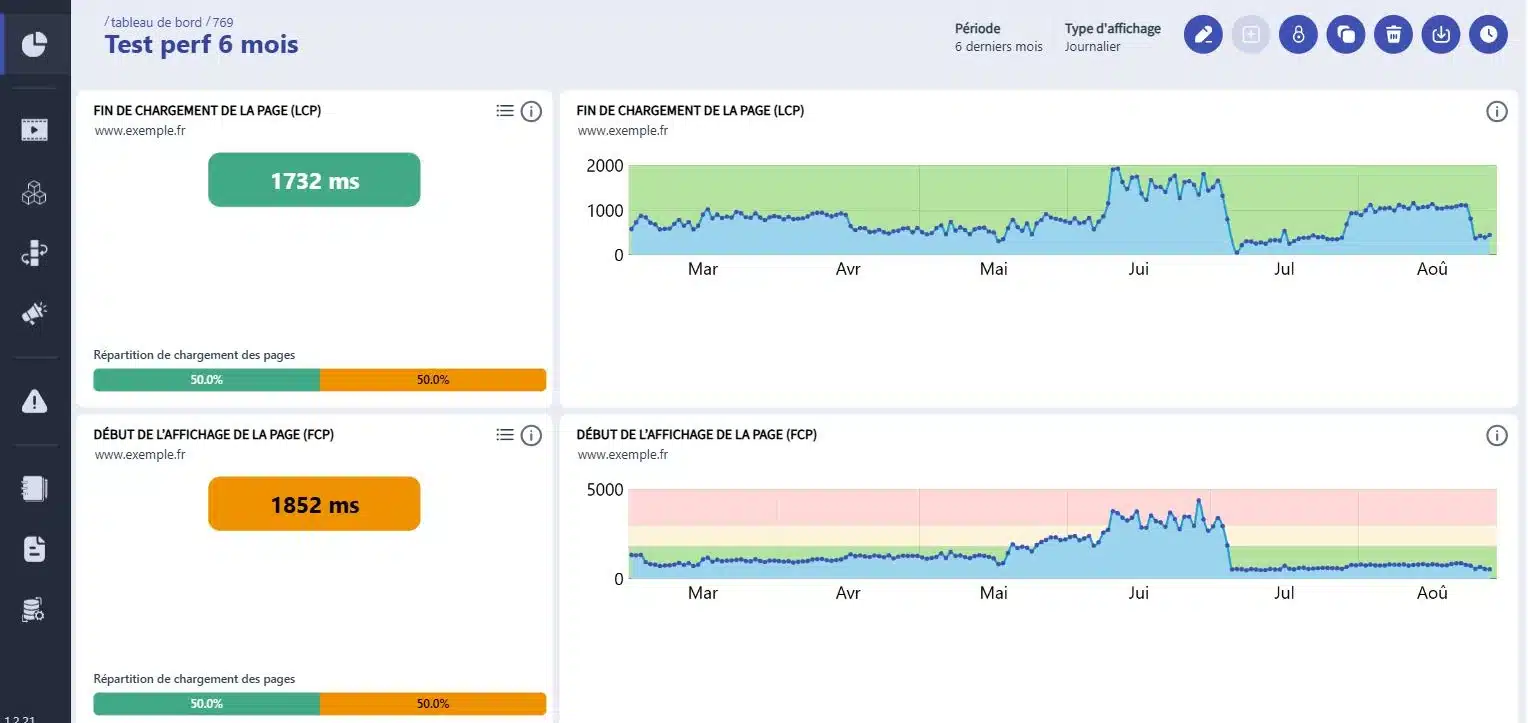
Mr Suricate  Performance Dashboard: LCP and FCP measured over six months, along with their thresholds

They trust us

Retail, banking, manufacturing, transportation, and services: Our clients run nearly 3 million scenario simulations per month on their critical workflows.

A slow app is still an app that works

That’s what makes this issue so challenging. Nothing is wrong—the monitoring system shows everything is fine—and yet the command tunnel is taking three times as long as it did a month ago. The degradation is gradual; no one inside the system notices it, and it first becomes apparent in the abandonment rate. An automated performance test reveals it as it takes hold.

Mouse icon

The time it takes to complete the course, not the server's time

What matters is the time between the click and when the screen is actually usable. It is measured throughout the entire user journey, step by step.

Purple Rectangles Icon

You set the acceptable time for each step. If that time is exceeded, an alert is triggered—not another report.

Purple Gear Icon

The Shift Over Time

Each run is comparable to the previous one. A 20% decline spread over three weeks is visible in the curve.

Purple API Test Icon

The same scenarios run during pre-production and production, at the times when your business is actually busy.

Integrates with your pipeline without rewriting it

Your performance metrics are triggered from your CI, run in your production environments, and are reported back to where your teams are already working. No retooling required.

1 Triggering Your tools stay in control
  • GitLab
  • Jenkins
  • Microsoft Azure
  • API Call
  • Planning
2 ExecutionMr SuricateYour scripts run on your production environments
  • Web Tour
  • Native iOS and Android Apps
  • Real Mobile Farms
  • APIs and Internal Feeds
3 Restitution The results are delivered right to your workplace
  • Jira
  • Slack
  • SMS
  • Webhook
  • API
And maintenance that stands the test of time
  • Reusable blocksA change updates all scenarios that use it
  • AI-Assisted CorrectionSuggested corrections for scenarios with errors
  • Grouping IncidentsSimilar anomalies are processed only once

How continuous measurement changes things, line by line

Without continuous measurement
With Mr Suricate
The slow response time is due to customer service.
It goes back to when the threshold was exceeded.
We measure it once the problem has already arisen.
The meter runs continuously, even during charging.
A performance audit provides a snapshot at a given moment.
You'll see the trend, week by week.
The debate centers on feelings.
It covers time frames, step by step.
We're optimizing the homepage, which isn't the problem.
The slowest stage of the route has been identified.
Performance is a one-time project.
This is a line from your weekly report.
ResultThe response time for each critical step, measured continuously and comparable from one week to the next.
PRACTICAL GUIDE · 2026 EDITIONSoftware Quality and Testing: The Essential GuideThe fundamentals of functional testing, common pitfalls, and a method for building test coverage that stands the test of time.
Download the guide
Mr Suricate a no-brainer, because he gives you the assurance that there are no problems. Finding just one bug is enough to make the solution pay for itself for an entire year!”

Anthony CornevinE-commerce Platform Manager, Vertbaudet

Support that ends whenever you want

Mr Suricate replace your QA team—it enhances it. You decide what to handle in-house and what to outsource: creating test scenarios, running them, or maintaining them over time.

  1. 1Identification of critical paths, front-end and back-end
  2. 2Writing Tests Without Code
  3. 3Continuous monitoring and alerts
  4. 4Scenario Maintenance and Development
ResultYou gain broader coverage without increasing your teams’ workload. And if you’d rather delegate everything, QA outsourcing takes over.

YOUR QUESTIONS

Frequently Asked Questions

The questions teams ask us most often about performance measurement.

What is the difference between a performance test and a load test?

The performance test measures the response time of a workflow under normal, continuous usage conditions. The load test, on the other hand, identifies the breaking point by simulating a massive influx of simultaneous users. The two are complementary and are handled separately.

What exactly is Mr Suricate measuring Mr Suricate

The actual duration of each step in a user journey: load time, response time for an action, and the time it takes for a screen to become usable. The measurement focuses on the business workflow, not on an isolated server metric.

Can we measure production performance?

Yes, and that's actually the most useful scenario. The same scenarios run during pre-production and production, during peak hours for your business. When working with production data, the rule is to use only data created for testing purposes.

How are we notified when a threshold is exceeded?

The alert is sent via the channel you've defined for the relevant scenario: email, Slack, SMS, or a webhook to your own tool. Critical scenarios may have a different channel and time limit than others.

Are mobile apps covered?

Yes. Native iOS and Android apps are run on actual device farms, which allows us to measure response times on the models and OS versions that your customers actually use.

What measures have been reported?

Loading metrics tracked over time: receipt of the first byte, start of rendering, completion of loading the largest element, and visual stability. Each metric is compared to its threshold, and the dashboard shows the breakdown of pages that meet or do not meet that threshold.

Can a test be failed based on response time?

Yes. A performance threshold is specified in the scenario configuration, in milliseconds, and applies to requests whose URL begins with a given pattern. If the threshold is exceeded, the step fails just like any other assertion.

What information does a developer have access to for troubleshooting?

The HAR archive of the execution, which contains details of the network requests. It can be replayed in the browser’s developer tools, eliminating the need to reproduce the issue manually. The load times in the execution report can also be sorted.

Is this the same thing as a performance audit?

No, and that difference matters. An audit provides a score at a specific point in time. Here, measurements are taken at every scheduled run, along your users’ actual journey, which allows you to see trends rather than just a single data point.

Do you only believe what you see?

A 30-minute demo of your own app. You'll see one of your workflows automated in real time, without writing any code.