









Types of Tests

Production Monitoring: Your Processes Monitored Continuously

Your monitoring system tells you that the servers are responding. It doesn't tell you that the command tunnel has been down since this morning. Path monitoring simulates your critical scenarios in production, day and night.

Operates 24 hours a dayAlert by channelWeb, Mobile, and APIs

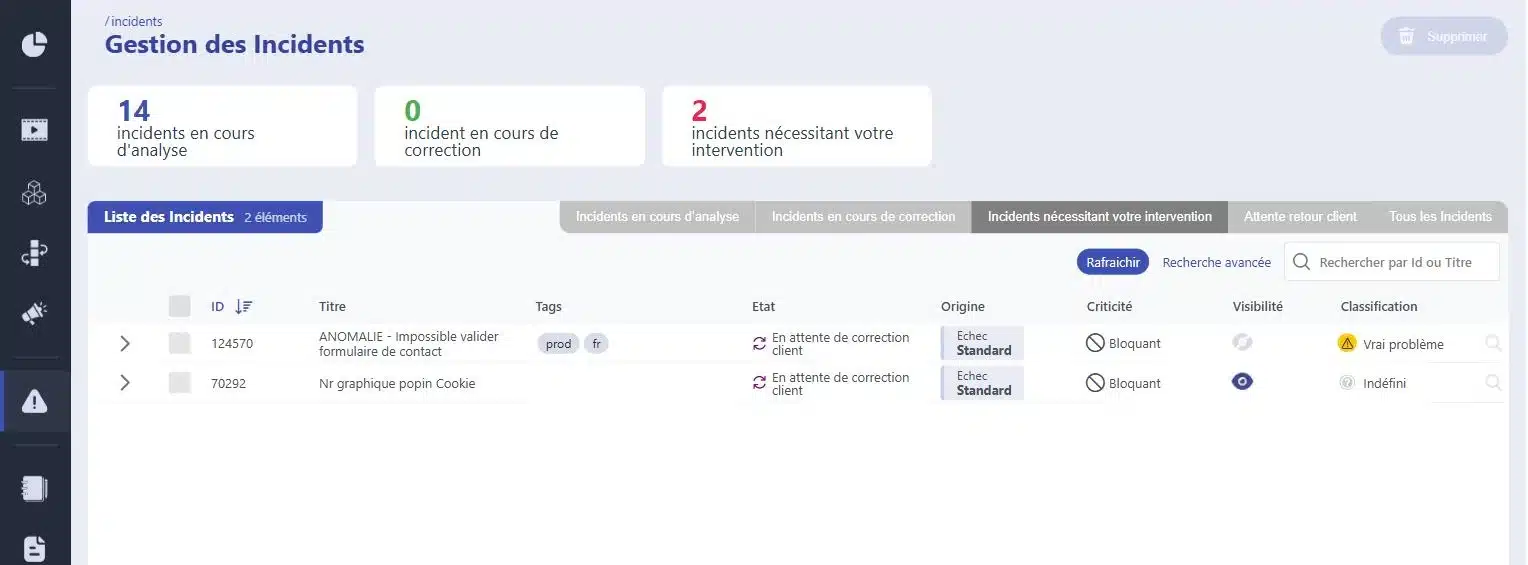
Incident Management in Mr Suricate : Status, Severity, and Classification Between True Problems and False Positives

They trust us

3 million scenario runs per month100+ clients15 types of tests covered

Retail, banking, manufacturing, transportation, services. Hosting in the European Union, French-language support, personalized assistance during the startup phase.

In a nutshell

Production monitoring continuously re-runs your critical workflows in the production environment at regular intervals to detect a failure before your users do. It relies on the same scenarios as functional tests, and each failure is classified before it becomes an alert, which helps avoid false positives.

These are the same scenarios used for your functional tests, performance measurements, and load testing. A test suite written once can be used for all four purposes.

Production monitoring, MTTD, and MTTR, criticality: See the QA glossary for definitions.

A route failure does not trigger any technical alarms

The servers are responding, error rates are normal, and infrastructure monitoring shows everything is green. And yet, no one has been able to make a payment since the payment provider’s update last night. This type of outage isn’t reflected in any system metrics. It becomes apparent when you simulate the user journey, just as a customer would.

A network of car dealerships thus has us check every day for the actual wait time until the first available appointment. No monitoring tool can answer this question, because it’s not a matter of availability.

Mouse icon

The course, not the server

A complete scenario run in production at regular intervals. That's the only way to know that the service is actually working—and not just responding.

Purple Rectangles Icon

Email, Slack, text message, or a webhook to your tool. A payment triggers the on-call alert; the contact form waits until morning.

Purple Gear Icon

Evidence of what happened

Screenshot, exact step, timestamp. The team starts with a documented observation, not an attempt to reproduce the issue.

Purple API Test Icon

You don't have to rewrite anything. The script that validates a test case then measures response times and monitors production using its own data.

What We Monitor from a Business Perspective

Your monitoring tools answer a technical question: Is the service up and running? The business side asks another: Is what the customer sees on the screen accurate? In between, there’s everything that breaks a promise without breaking a page.

The announced timeframeFirst available appointment slot, delivery time, processing time for a request. We track what the customer reads, not what the database contains.
Actual AvailabilityDisplayed stock, products that can actually be ordered, and time slots that can be reserved all the way through. An item that appears in the shopping cart but cannot be added counts as unavailable.
Price and FeesListed price, shipping costs, applied discount, and required disclosure are all displayed. Any discrepancy between the product page and the shopping cart is immediately apparent.
Consistency Across ChannelsWebsite, mobile app, customer portal. The same customer journey played out across each channel, to identify any discrepancies in promises from one platform to another.

The alert goes wherever your team reads it

Your routes are simulated at the frequency you choose, from the outside, just like a real user. The alert is sent to where your team will see it.

1 Triggering Your tools stay in control
  • GitLab
  • Jenkins
  • Microsoft Azure
  • API Call
  • Planning
2 ExecutionMr SuricateYour scripts run on your production environments
  • Web Tour
  • Native iOS and Android Apps
  • Real Mobile Farms
  • APIs and Internal Feeds
3 Restitution The results are delivered right to your workplace
  • Jira
  • Slack
  • SMS
  • Webhook
  • API
And maintenance that stands the test of time
  • Reusable blocksA change updates all scenarios that use it
  • AI-Assisted CorrectionSuggested corrections for scenarios with errors
  • Grouping IncidentsSimilar anomalies are processed only once

How Route Monitoring Is Changing Things, Line by Line

Infrastructure Monitoring Only
With route tracking
We know that the server is responding.
We know that the customer can make a purchase.
The outage was reported by a dissatisfied customer.
It is foreshadowed in the script, before he is.
The detection time is measured in hours.
It's measured in minutes.
The team starts by trying to replicate it.
It starts with a screenshot and a specific step.
A system failure at a third-party service provider goes unnoticed.
She was eliminated on the first obstacle of the course.
On the weekend, no one is watching.
The scenario runs anyway, and the alert is triggered.
ResultA route failure detected within minutes, complete with a screenshot and the exact location, rather than a call to customer service.

Qualified before becoming an alert

A move is first replayed automatically, which eliminates temporary glitches before any alerts are triggered
Anything that resists replay triggers an incident, along with its status and criticality
Failures that share the same cause are grouped into a single incident—not one alert per occurrence
The cause is specified, which distinguishes an application failure from an external outage
The visibility indicates whether the issue affects all users or a specific case
A human distinguishes between a real problem and an undefined one: it is this step that determines what wakes you up

What this sorting process prevents

An alert triggered by a network issue that would have disappeared by the next play
The alert triggered by a section of the page that changes on its own
The dozens of identical notifications caused by a single issue
The alert channel that the team eventually turns off because it's too loud
The time spent reclassifying a topic that is already known
PRACTICAL GUIDEOnline Customer Journey: The Basics of a Seamless ExperienceWhat disrupts a customer journey in production, where to spot it, and how to identify it before your customers do.
Download the guide
Mr Suricate a no-brainer, because he gives you the assurance that there are no problems. Finding just one bug is enough to make the solution pay for itself for an entire year!”

Anthony CornevinE-commerce Platform Manager, Vertbaudet

Who monitors incidents at night—you or us?

With Mr Suricate, your QA team isn’t replaced—it’s strengthened. You choose what to handle in-house and what to outsource: defining the test paths to monitor, following up on alerts, or maintaining test scenarios.

  1. 1Identification of critical paths, front-end and back-end
  2. 2Writing Tests Without Code
  3. 3Continuous monitoring and alerts
  4. 4Scenario Maintenance and Development
ResultYou gain broader coverage without increasing your teams’ workload. And if you’d rather delegate everything, QA outsourcing takes over.

YOUR QUESTIONS

Frequently Asked Questions

The most common questions we get about production monitoring.

How is this different from traditional infrastructure monitoring?

Infrastructure monitoring tracks components such as server availability, URL response times, and error rates. Workflow monitoring simulates the entire business scenario. This is what makes it possible to detect a functional failure even when the entire technical stack is showing "green."

How often are the scenarios played?

You choose the frequency on a per-scenario basis, ranging from a cycle of a few minutes for a payment flow to a daily run for a secondary form. The appropriate setting is determined by the cost of one hour of downtime for the flow in question.

How are we notified in the event of a breakdown?

The alert is sent via the channel defined for the scenario: email, Slack, SMS, or a webhook to your own tool. Critical scenarios can have a different channel, recipient, and time limit than other scenarios, which prevents the on-call team from being woken up for a minor incident.

How do you avoid false alarms?

A failure is first automatically replayed: anything caused by a temporary glitch disappears without triggering an alert. Anything that persists after replay triggers an incident, and failures with the same root cause are grouped into a single incident rather than generating an alert for each occurrence. A human then assesses the incident before it becomes an alert.

Is it risky to run tests in production?

The rule is simple: in production, we use only data created for testing. The test scenarios rely on dedicated accounts and datasets, and any steps that would produce an undesirable real-world effect are limited to the scope of the test scenario.

Can acceptance test scenarios be reused?

Yes, and it’s the fastest way to get started. A pre-written non-regression test scenario becomes a production probe by changing its environment and data, and the same scenario is also used to measure response times step by step. You only need to maintain a single test suite, whereas a testing tool, a load testing tool, and a monitoring tool would require you to maintain three.

Is this an APM or RUM tool?

No, and it’s best to establish this limitation right from the start. Mr Suricate synthetic monitoring: it replays complete user journeys at regular intervals. It does not measure your visitors’ actual sessions and does not instrument your application code.

What exactly are we monitoring?

End-to-end user journeys, not just page availability. A website might return a 200 status code but have a broken checkout process at the payment stage—this is exactly the kind of issue that journey monitoring detects.

How can you avoid skewing your analytics data?

Executions can be identified and excluded from your reports by IP address or by parameter, depending on your tool. The filtering is set up at launch, before the first campaign.

Should we set up special access points in the production environment?

Dedicated test accounts are sufficient in most cases. For sensitive steps, we work together to define the scope of the scenario and what it does not trigger.

What business metrics can you track?

Anything that appears in an interface: a lead time, a price, inventory levels, a time slot, a fee, or a required disclosure. If a customer can see it, we can note it and compare it to what is expected.

Do you have any at-risk income?

No, and we prefer to be upfront about it. We provide a detailed business impact analysis: which user journey is affected, at what stage, and since when. The cost estimate in euros depends on your conversion data and is calculated in collaboration with your analytics team.

Do you only believe what you see?

A 30-minute demo of your own app. You'll see one of your workflows automated in real time, without writing any code.