










Types of Tests

Graphical Tests: Detect WhatNo Assertion Can See

A block shifts out of place, a font changes, a button ends up below the fold. The page works, all the tests pass, and yet it no longer looks the way it should.

Pixel-by-pixel comparisonAll resolutionsConfigurable exclusion zones

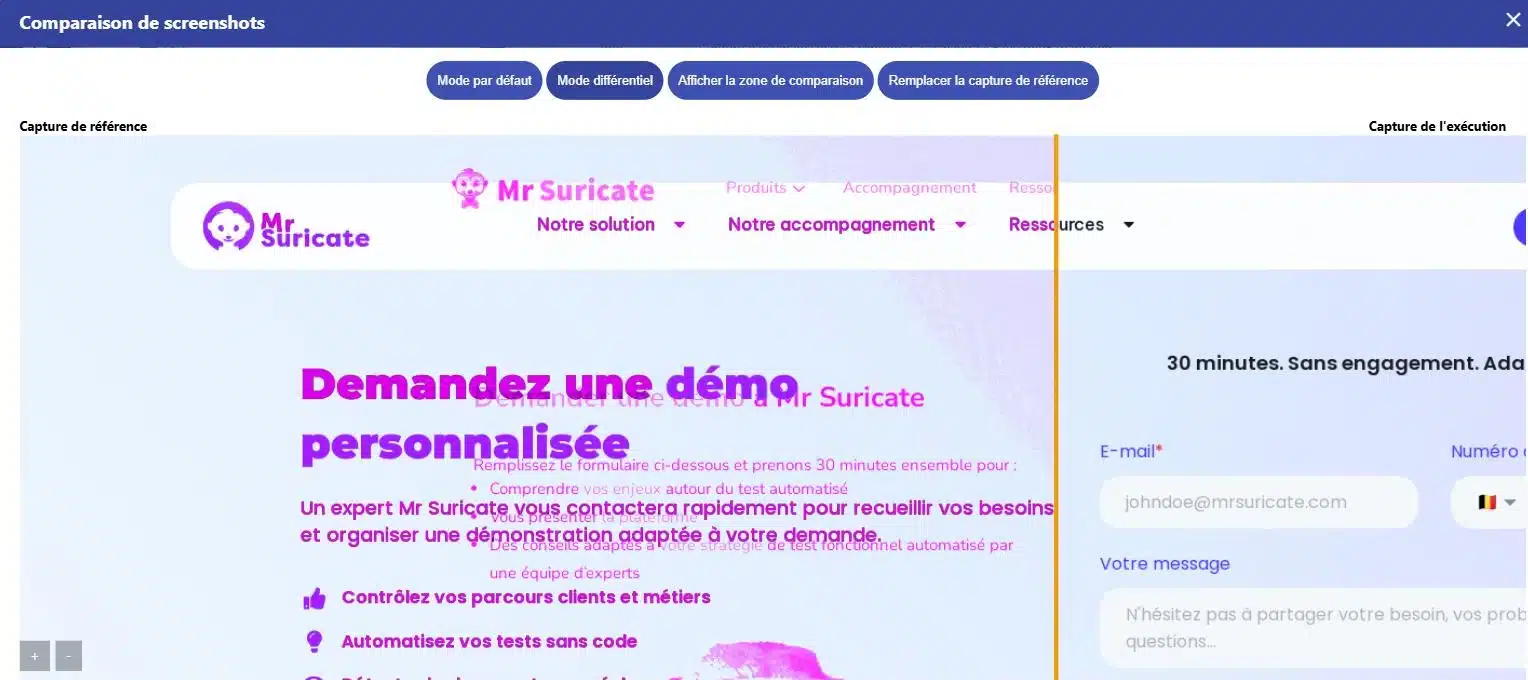
Graphical comparison screen in Mr Suricate, in differential mode highlighting the areas that have changed between the baseline capture and the run

They trust us

3 million scenario runs per month100+ clients15 types of tests covered

Retail, banking, manufacturing, transportation, services. Hosting in the European Union, French-language support, personalized assistance during the startup phase.

In a nutshell

A graphical test compares a page's display to a validated reference to identify issues that no assertion can detect: a misaligned block, truncated text, or a required field that has disappeared. The tolerance threshold and the moving areas can be adjusted, which prevents false alarms from being triggered with every run.

false positive, regression, DOM: See the QA glossary for definitions.

A website can be functional and broken at the same time

A library update changes the height of a component, causing the price to be hidden behind an image on mobile devices. The checkout process still works, and no tests report any errors, but no one can see the amount anymore. On a regulated website, the same issue could cause a required disclosure to disappear from the page.

Mouse icon

The page compared to its reference

A reference screenshot, a screenshot from today, and the difference highlighted. You can either approve the new version or make corrections.

Purple Rectangles Icon

A threshold that you set

A shadow that shifts by one pixel is not considered an issue. The tolerance threshold is set on a page-by-page basis.

Purple Gear Icon

Excluded shifting areas

Promotional banner, today's date, carousel, advertisement. These areas are ignored to prevent false alerts.

Purple API Test Icon

The same page viewed on desktop, tablet, and your audience's mobile devices.

Catches compared for each deployment

Your graphical comparisons are triggered from your CI, run on your production environments, and feed back into the systems where your teams are already working. No retooling required.

1 Triggering Your tools stay in control
  • GitLab
  • Jenkins
  • Microsoft Azure
  • API Call
  • Planning
2 ExecutionMr SuricateYour scripts run on your production environments
  • Web Tour
  • Native iOS and Android Apps
  • Real Mobile Farms
  • APIs and Internal Feeds
3 Restitution The results are delivered right to your workplace
  • Jira
  • Slack
  • SMS
  • Webhook
  • API
And maintenance that stands the test of time
  • Reusable blocksA change updates all scenarios that use it
  • AI-Assisted CorrectionSuggested corrections for scenarios with errors
  • Grouping IncidentsSimilar anomalies are processed only once

What the line-by-line visual comparison reveals

Without a visual comparison
With Mr Suricate
The discrepancy becomes apparent when a customer points it out.
You can see him in the screenshot, on the day of delivery.
We skim through the key pages when we have time.
All reference pages are compared.
A successful functional test suggests that everything is working properly.
In addition to behavior, appearance is also checked.
A hidden legal notice remains hidden.
The discrepancy is noted along with the affected area.
The cell phone is checked last, so not very often.
All resolutions are passed at the same time.
The debate centers on impressions.
It involves two images and a percentage.
ResultVisual discrepancies detected upon delivery, including a before image, an after image, and the exact location of the discrepancy.

What the comparison covers

Difference between today's catch and a benchmark you have approved
Adjustable tolerance threshold, so that a pixel's shadow won't wake anyone up
Excluded dynamic areas: promotional banner, today's date, carousel, advertisement
The same page viewed on a desktop, a tablet, and on actual mobile screen resolutions
Get feedback with every deployment, right from your pipeline

What It Is Not

A Designer's Perspective on Graphic Quality
A review to ensure compliance with a style guide or design system
A Contrast Accessibility Test
A library of components compared in the workshop, outside of actual driving conditions

Regression, threshold, false positive: See the QA glossary for definitions.

WHITE PAPER · TEST AUTOMATIONWhat if your bugs no longer cost your business anything?The true cost of a broken display, and the fundamentals of testing you need to consider before automating.
Download the white paper
Mr Suricate a no-brainer, because he gives you the assurance that there are no problems. Finding just one bug is enough to make the solution pay for itself for an entire year!”

Anthony CornevinE-commerce Platform Manager, Vertbaudet

You decide on the differences; we provide the benchmarks

With Mr Suricate, your QA team isn't replaced—it's strengthened. You choose what to handle in-house and what to outsource: creating test scenarios, running them, or maintaining them over time.

  1. 1Identification of critical paths, front-end and back-end
  2. 2Writing Tests Without Code
  3. 3Continuous monitoring and alerts
  4. 4Scenario Maintenance and Development
ResultYou gain broader coverage without increasing your teams’ workload. And if you’d rather delegate everything, QA outsourcing takes over.

YOUR QUESTIONS

Frequently Asked Questions

The most common questions we get about graphics tests.

What is a graphics test?

This is the automatic comparison of a screenshot with a validated reference screenshot. Any deviation beyond the threshold you have set is flagged, and the affected area is highlighted. This is also known as a visual regression test.

How do you avoid false positives?

Through four settings. An explicit delay before capturing, since the most common cause is still an image taken while the page is loading. A pixel difference tolerance, which accounts for minor rendering variations. Consideration of size differences between the two captures. And the exclusion of moving elements: promotional banners, dates, carousels, and ads. Without these exclusions, a dynamic page triggers an alert every time it runs, and eventually no one pays attention to the alerts anymore.

What should you do when change is desired?

You replace the baseline screenshot from the comparison screen, and the new version becomes the basis for subsequent runs. This is an explicit action: no visual changes go into production without someone having reviewed and approved them.

Is this useful if we already have functional tests?

Yes, because the two don't detect the same thing. A functional test verifies that an action produces the correct result. It doesn't detect when an element is hidden behind another, unreadable, or off-screen, even though the page remains fully usable by a machine.

Does this cover the required disclosures?

This is a common practice in regulated industries. A rate, legal notice, or warning that disappears as a result of a layout change poses a compliance risk, and this is exactly the type of discrepancy that visual comparison brings to light.

What does the result of a comparison look like?

A screen that displays the reference capture and the runtime capture side by side, with a slider to switch between them. A differential mode superimposes the two and highlights the areas that have changed.

Can we compare anything other than an entire page?

Yes. The comparison can focus on a specific element rather than the entire screen, which prevents a promotional banner or carousel from causing the test to fail even though the component being monitored hasn't changed.

How many resolutions should be compared?

At least one desktop resolution and one mobile resolution, since these are two different layouts. Each resolution tracked is compared to its own baseline, which prevents a mobile discrepancy from being lost in an overall assessment. The choice is based on your audience statistics rather than on a theoretical list of devices.

How is this different from a design system tool?

Component tools compare isolated interface building blocks in a lab setting and are intended for the developers who build them. Here, the comparison focuses on the actual page—as it appears in your production environments—with its current data and content. The two approaches do not identify the same regressions, and the second one does not require any coding knowledge.

Do you only believe what you see?

A 30-minute demo of your own app. You'll see one of your workflows automated in real time, without writing any code.