










Types of Tests

Green IT Tests: Measure the Actual Weight of Your Routes

A web page rarely gets heavier all at once. It gains 200 kilobytes with each update, one tag at a time, and no one notices until it weighs three times as much as it did originally.

Weight and Queries by RouteLong-Term MonitoringWeb and Mobile

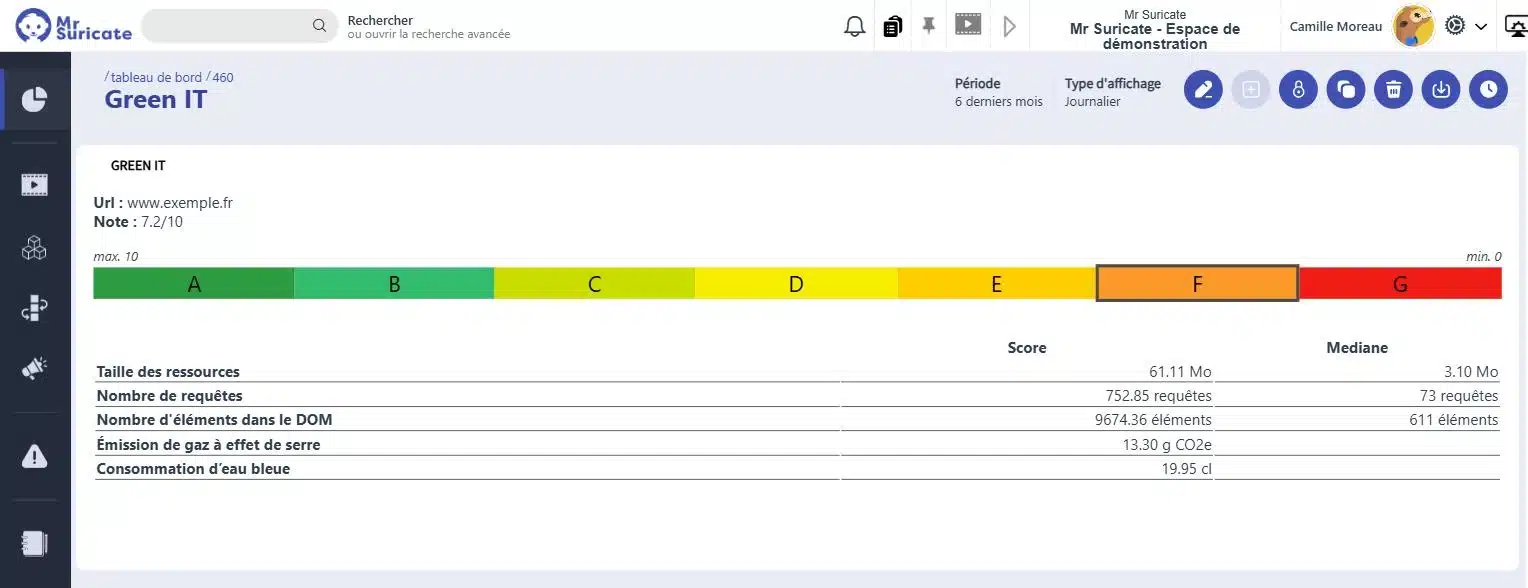
Green IT Dashboard on Mr Suricate : ratings from A to G and five carbon footprint metrics compared to their median values

They trust us

3 million scenario runs per month100+ clients15 types of tests covered

Retail, banking, manufacturing, transportation, services. Hosting in the European Union, French-language support, personalized assistance during the startup phase.

In a nutshell

A Green IT test measures the transferred load and the number of requests for a complete journey, including a breakdown by resource type and the proportion of third-party domains. When repeated over time, it reveals the trend: what is becoming heavier with each delivery, and why.

What gets heavier never comes back down on its own

A tag added for a campaign remains there after the campaign ends. A library loaded for a component is loaded on every page. An uncompressed image is allowed because it doesn’t cause any problems. Each of these decisions is reasonable on its own, but together they result in a four-megabyte product page that no one intended.

Mouse icon

A five-step checkout process means five page loads. The measurement focuses on the actual user journey rather than the homepage.

Purple Rectangles Icon

Requests and Their Origins

Number of calls, weight by resource type, percentage of third-party scripts. That’s where most of the performance issues lie.

Purple Gear Icon

The graph, not the photo

A single measurement doesn't tell us anything. When compared to the previous week's measurement, it indicates responsible delivery.

Purple API Test Icon

You set the acceptable weight for each size. Any excess is flagged just like any other deviation.

Weight measured at each visit, not just once a year

The Green IT metric is triggered from your CI, runs in your production environments, and feeds back into the systems where your teams are already working. No need to retool.

1 Triggering Your tools stay in control
  • GitLab
  • Jenkins
  • Microsoft Azure
  • API Call
  • Planning
2 ExecutionMr SuricateYour scripts run on your production environments
  • Web Tour
  • Native iOS and Android Apps
  • Real Mobile Farms
  • APIs and Internal Feeds
3 Restitution The results are delivered right to your workplace
  • Jira
  • Slack
  • SMS
  • Webhook
  • API
And maintenance that stands the test of time
  • Reusable blocksA change updates all scenarios that use it
  • AI-Assisted CorrectionSuggested corrections for scenarios with errors
  • Grouping IncidentsSimilar anomalies are processed only once

How continuous measurement changes things, line by line

Without footprint tracking
With Mr Suricate
The weight is determined during an annual audit.
It is measured with every delivery.
It's unclear which shipment caused the page to become heavier.
The graph shows the date and the deviation.
Third-party scripts are piling up without any oversight.
Their share of the total weight is visible.
A campaign beacon remains in place for years.
His contribution stands out in this regard.
Environmental commitment is based on intentions.
It is based on a series of measures.
Optimization is a one-time project.
This is a metric in your report.
ResultThe weight and number of requests for each route, measured at each delivery and comparable over time.

What the measure covers

Data transferred and number of requests for a complete run
Breakdown by Resource Type and Share of Third-Party Domains
Scores and grades recorded for each performance, comparable over time
Weight threshold by size category, with an alert if exceeded
Native apps, based on the score recorded in the currently running app

What It Is Not

A Corporate Carbon Footprint Assessment
A Life Cycle Assessment
A hosting or data center audit
Feedback on Your Energy Mix

EcoIndex, CSRD, Green IT: The definitions can be found in the QA glossary.

What You Are Asked to Prove

Non-Financial Report

The CSRD requires verifiable metrics, not estimates. A set of dated measurements along identified routes provides data that the auditor can track.

RGESN

The general eco-design framework for digital services, published by Arcep and Arcom in 2024, provides a structure for the process. The weight and number of requests in a user journey are a direct measure of this.

Rays of Hope

Public procurement agencies and large corporate clients now require quantifiable digital metrics. A dated report broken down by user journey meets this requirement; a statement of intent does not.

A helpful note for meetings: This metric contributes to a report; it does not replace it. The scope is the user journey, not the company.

PRACTICAL GUIDE · 2026 EDITIONSoftware Quality and Testing: The Essential GuideThe fundamentals of functional testing, common pitfalls, and a method for building test coverage that stands the test of time.
Download the guide
“An easy-to-use, fun tool that’s similar to Scratch. The campaign management feature gives me peace of mind before each deployment.”

Coralie Cebron de LisleSoftware Tester, Optivalue

You set the acceptable weight; we measure it

With Mr Suricate, your QA team isn't replaced—it's strengthened. You choose what to handle in-house and what to outsource: creating test scenarios, running them, or maintaining them over time.

  1. 1Identification of critical paths, front-end and back-end
  2. 2Writing Tests Without Code
  3. 3Continuous monitoring and alerts
  4. 4Scenario Maintenance and Development
ResultYou gain broader coverage without increasing your teams’ workload. And if you’d rather delegate everything, QA outsourcing takes over.

YOUR QUESTIONS

Frequently Asked Questions

The most common questions we get about footprint measurement.

What exactly does a Green IT test measure?

The load transferred and the number of requests for a complete user journey, broken down by resource type and the proportion of third-party domains. This is objective data, measured during scenario execution, and comparable from one week to the next.

Does this calculate a carbon footprint?

The test provides the input data for such a calculation, not the calculation itself. Converting kilowatts to carbon equivalent involves assumptions about the energy mix and the device fleet, which are part of your methodology rather than the test tool.

How does this relate to performance?

They overlap without being the same. A heavy page is often slow, but a light page can be slow due to a slow-responding backend service, and a heavy page can seem fast on a good connection. The two metrics should be considered together.

How do you set a reasonable threshold?

Start with your own history rather than an external standard. The primary goal isn't to reach a target weight, but to prevent weight gain: use your current weight as a baseline and refuse to let it increase without an explicit decision.

Is this useful for a non-financial report?

Yes, provided you define the scope. A series of dated measurements along identified routes constitutes solid, verifiable data—far more defensible than a general estimate produced once a year. Whether it’s CSRD reporting, a carbon footprint assessment, or a response to a request for proposals that requires numerical indicators, in all three cases, it is the dated measurements linked to an identified route that hold up to scrutiny.

What measures have been reported?

Five: the size of loaded resources, the number of requests, the number of elements in the DOM, greenhouse gas emissions in grams of CO2 equivalent, and water consumption. Each metric is compared to a reference median, which places the page relative to typical usage.

How do you read the note?

A score out of ten and a rating from A to G. The score alone doesn't tell us much: it's the deviation from the medians that indicates where action is needed—most often regarding the weight of resources and the number of requests.

Does the metric apply to a single page or to a user journey?

On pages that are part of a user journey. This means you’re measuring the footprint of the actual path your users take, not that of an isolated homepage, which accounts for only a fraction of the traffic.

Can we track the trajectory over time?

Yes, a dashboard shows how page scores have changed over the selected time period. This allows us to verify that a site optimization effort is having an effect—and that a new feature isn’t undoing it three months later.

Does Green IT cover native mobile apps?

Yes, in the same scenarios. A dedicated block retrieves the Green IT score of the running application, and you set a threshold for it just as you would for any other check: if the score exceeds that threshold, the discrepancy is reported as an incident. A mobile session is therefore monitored just like a web session, without the need for a separate tool.

Is a dedicated tool needed for measuring carbon footprints?

They do exist, and that's exactly what they're designed for. The difference here is that there are no additional tools to run and no test sequences to rewrite: the metrics are collected during the tests you're already running—both on the web and on mobile—at the same time and in the same report.

Do you only believe what you see?

A 30-minute demo of your own app. You'll see one of your workflows automated in real time, without writing any code.